
Introduction
Childhood overweight and obesity are public health problems due to the high risk of developing short and long-term comorbidities (insulin resistance, type 2 diabetes mellitus, arterial hypertension, dyslipidemia, cerebrovascular events and cancer) [1, 2]. Since 2001 it has been recognized that not all individuals with overweight or obesity have the same risk of metabolic complications and mortality [3–5]. In 2008 Wildman et al. proposed two subgroups of obese individuals: metabolically healthy obese (MHO) defined as those who do not present metabolic syndrome according to the criteria of the International Diabetes Federation (IDF) and do not present insulin resistance (IR) according to Homeostatic Model Assessment for Insulin Resistance (HOMA-IR) and metabolically unhealthy obese (MUHO), when they present at least one of the above criteria [5].
The parameters for classifying children with obesity as MHO or MUHO have not been clearly established [6]. Damanhoury et al. in 2018 attempted to unify the diagnostic criteria, but recent studies have recognized the variability in the cut-off levels of clinical and biochemical parameters [7–10], thus, there is a need to identify additional metabolic risk markers to identify MUHO patients at risk for metabolic complications [10].
Uric acid (UA) has been considered an inflammatory marker associated with obesity. The increase in UA levels correlates with an increase in the intake of foods with a high content of purines, fructose or alcohol, and by alterations in their metabolism [11]. Excessive fructose intake leads to increased UA by intracellular hepatocyte ATP depletion and increased production of inosine monophosphate whose final degradation products include xanthine and uric acid, and upregulates GLUT 9 transport protein, a urate transporter expressed in the proximal renal tubule. Excessive fructose intake also leads to increased UA synthesis from amino acid precursors [11, 12].
The increase in UA has a significant prooxidant effect by reducing nitric oxide production in endothelial cells, inhibiting adiponectin synthesis and altering the tricarboxylic acid cycle and beta oxidation, favoring the production of angiotensin II and generating chronic inflammatory reactions. This could lead to metabolic deterioration with a greater predisposition to insulin resistance (IR), dyslipidemia, hypertension and fatty liver [13].
Mangge et al. [14] documented elevated levels of UA as a significant predictor of MUHO in youth and adults. Publications including pediatric patients on this are limited.
Our objective was to describe the difference between UA levels in children with obesity and overweight aged 5–18 years according to metabolic phenotype, and its relationship with clinical and biochemical variables associated with higher metabolic risk.
Material and methods
Study design
It was a retrospective cross-sectional study of analytical components. We included the clinical records of patients aged between 5 and 18 years with a diagnosis of obesity and overweight, as seen at the Pediatric Endocrine Clinic of the Hospital Universitario San Vicente Fundación, Hospital Infantil Concejo de Medellín and Hospital Alma Mater (Medellín, Colombia). This study was approved by the ethics committee of each participating hospitals.
Source of information
Consecutive sampling was then performed. The data were obtained by reviewing the medical records of patients evaluated at pediatric endocrine outpatient clinics using ICD10 codes: obesity due to excess of calories (E660), other types of obesity (E668), unspecified obesity (E669) and overweight (R635). The exclusion criteria were genetic obesity, Down syndrome, other diseases that modify UA values such as acute infection, systemic inflammatory disease, asthma exacerbation, uncontrolled hypothyroidism, and chronic use of the following medications: valproic acid, phenobarbital, thiazide diuretics, antituberculosis drugs, calcineurin inhibitors, testosterone supplements and allopurinol [15].
Collection process
The following data were collected from medical records: sex, age, weight, height, blood pressure, abdominal perimeter, Tanner stage, clinical signs of IR (acanthosis nigricans, keratosis pilaris, abdominal perimeter and lax fibroids), gestational age and birth weight. Biochemical data were obtained from medical records or laboratory reports of participating institutions. Biochemical data could not show a difference of more than three months compared to clinical data. The information was filled out in the Google Forms® form, wich was subsequently transferred to a Google Sheet® file. The patient information was anonymized.
Operational variables of the study
Overweight and obesity were defined as a body mass index (BMI) greater than 1 and 2 standard deviations respectively for age and sex according to the World Health Organization (WHO) classification. Patients were classified as metabolically healthy if they met all the criteria proposed by Damanhoury: triglycerides (TG) ≤ 150 mg/dl (≤ 1.7 mmol/l), high-density lipoprotein cholesterol (HDL-C) ≥ 40 mg/dl (≥ 1.03 mmol/l), fasting blood glucose ≤ 100 mg/dl (≤ 5.6 mmol/l), and systolic and diastolic blood pressure less than the 90th percentile [10, 16]. UA values were considered normal for age and sex, according to literature reference (supplementary Table I) [17]. Abnormal abdominal circumference was considered when value was over the 90th percentile according to the international classification by Xi et al. [18]. IR was evaluated according to clinical characteristics (acanthosis nigricans, skin tags, keratosis pilaris, increased abdominal perimeter) and by 3 biochemical laboratory parameters: HOMA calculated by multiplying fasting glucose in mg/dl by insulin in U/ml and divided by 405, taking as cut-off level in prepubertal patients a value ≥ 2.6 and in pubertal patients ≥ 4 [19]; the TG/HDL ratio was calculated by dividing triglycerides by HDL cholesterol in mg/dl [19], and the TyG ratio was calculated by estimating the natural logarithm applied to the result of multiplying the value of triglycerides and glucose in mg/dl divided by two [20].
Data analysis
Bivariate analysis was performed between the overweight/obesity phenotype (MHO/MUHO) and the demographic, clinical and paraclinical variables (TC, TG, HDL, glucose, ALT, TG/HDL, TyG, UA and HOMA-IR). Categorical variables were presented as absolute frequencies and percentages. Continuous variables were presented as mean and standard deviation or median and interquartile range according to their normality distribution tested using the Shapiro Wilk test. Student’s t-test was used to compare the difference between means in independent samples, and the Mann Whitney U test was used for the difference between medians. The chi-square test was applied for parametric categorical variables and Fisher’s exact test for non-parametric categorical variables according to the expected value. Spearman’s correlation analysis was performed to evaluate the correlation between uric acid and insulin resistance variables. Stadistical p-value was set in less than 0.05. Stata statistical software, version 17.0.
Bioethical standards
This study was approved by the Bioethical Committee of the University of Antioquia, number of agreement 056. Also, approvals were obtain from the participant institutions where the information was collected. No written consent taken from parents or from children because of the retrospective study with minimal risk.
Results
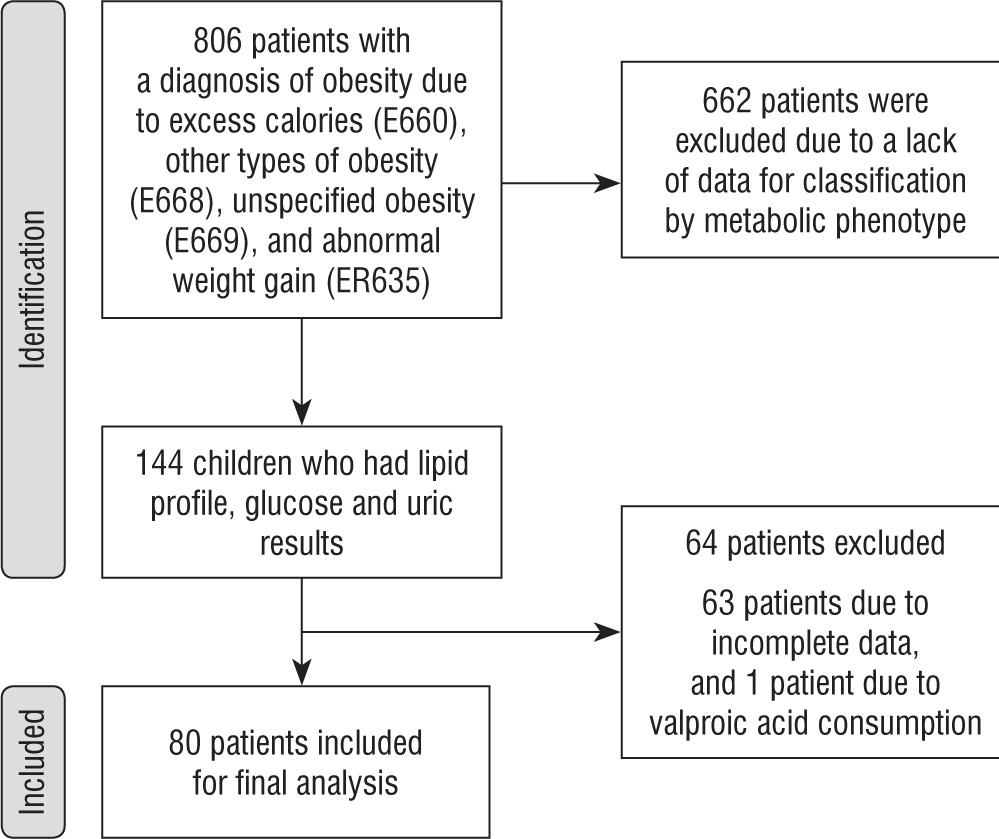
We reviewed 806 clinical records of patients between 5 and 18 years of age with a diagnosis of obesity or overweight according to ICD10 codes. Figure 1 shows the methodology used to collect and select 80 patients included in the study. The mean age was 11.6 years (SD 3.2), 50% of the sample was female, 76.25% of the population was classified as obese (mean BMI Z score +2.6, SD 0.8) and 23.75% were classified as overweight with a mean BMI Z score of +1.6 (SD 0.23).
According to Damanhoury’s criteria, 44 and 36 patients were defined as having MHO and MUHO, respectively. The distributions of sex, age, pubertal stage, overweight, and obesity were similar between the groups (Table I). The UA levels were significantly different (p = 0.0069) according to the metabolic phenotypes. The mean was 5.4 mg/dl (SD 1.3) in MUHO vs. 4.5 mg/dl (SD 1.4) in MHO, with a statistical power of 80% and statistical significance of 95% for the average difference. There were no differences in total cholesterol, LDL, fasting blood glucose or ALT between the MUHO and MHO groups. Levels of HDL (Median 38 mg/dl [IQR 34–43.7] in MUHO vs 51.3 mg/dl [IQR 43.8–53.7] in MHO, p < 0.001) Triglycerides (Median 155 mg/dl [IQR 114–188] in MUHO vs. 89 mg/dl [IQR 70.5–102.5] in MHO, p < 0.001) showing statistically significant differences (Table II).
Table I
Sociodemographic characteristics according to metabolic phenotype of obesity and overweight
Table II
Clinical and biochemical characteristics according to metabolic phenotype
The clinical signs of IR according to the individual’s metabolic phenotype did not show statistically significant differences (prevalence of 84% vs. 75% p = 0.312; Table II). A history of prematurity and low birth weight were evaluated as risk factors for metabolic compromise, with no difference found in the frequency of presentation according to the MHO and MUHO metabolic phenotypes.
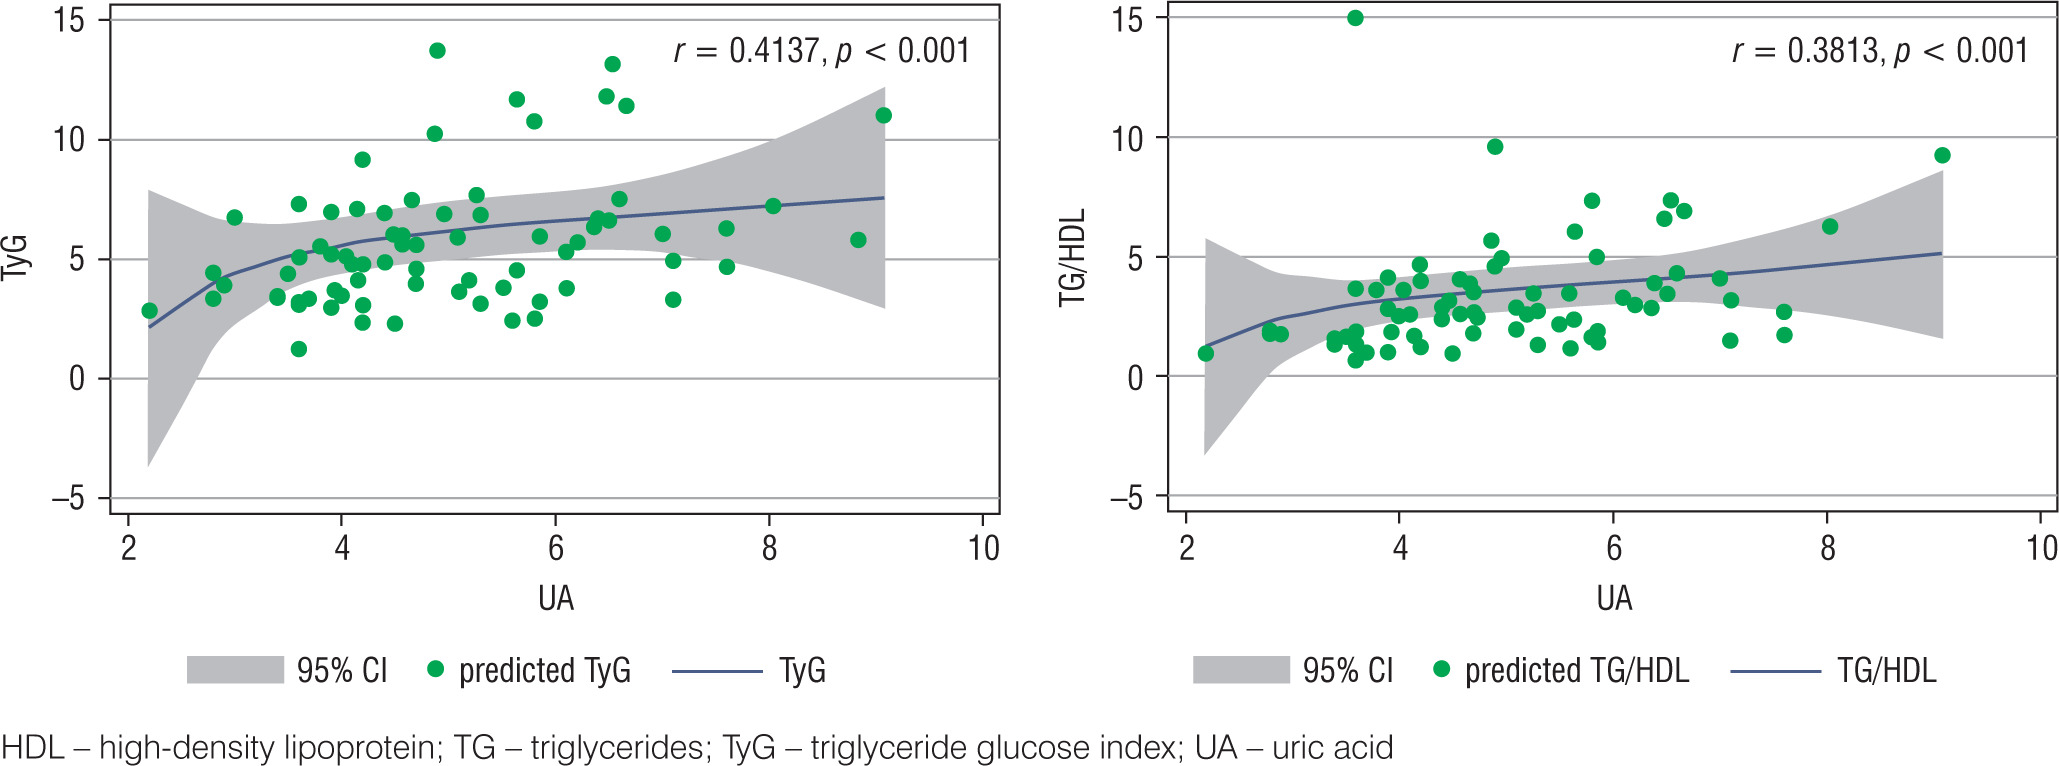
To evaluate the behavior of biochemical parameters of insulin resistance, three variables were calculated: HOMA-IR (3.5 [IQR 1.9–4.6] in MUHO vs. 2.5 [IQR 1.4–4.9] in MHO, p = 0.360), the TG/HDL ratio (median 3.9 [IQR 3.2–5.8] in MUHO vs. 1.7 [IQR 1.3–2.3] in MHO, p < 0.001) and TyG ratio (median 6.5 [IQR 4.9–7.6] in MUHO vs. 3.6 [IQR 3.1–4.7] in MHO, p < 0.001), showing statistically significant differences only in the last two variables (Table II). A moderate positive correlation was found between UA levels and the TyG ratio (correlation 0.4137; p < 0.001) and a slight positive correlation between UA and the TG/HDL ratio (correlation 0.3813; p < 0.001; Fig. 2). No correlation was found between UA values and the IMC-Z score, TC, c-HDL, c-LDL and HOMA-IR levels.
Discussion
Uric acid has been studied as a possible marker of cardio-metabolic risk [13]. In this study, we found that UA levels were higher among children with overweight or obesity who were classified as MUHO according to Damanhoury’s criteria [10]. This confirms previous findings reported in other populations and suggests that UA could be used as a predictor marker of metabolically unhealthy obesity, even from school age [14, 20–23]. In addition, a positive correlation was found between the increase in UA concentrations and the TG/HDL and TyG insulin resistance indexes, suggesting that UA could be used as an indirect marker of IR.
The percentage of patients classified as MHO varies according to the population evaluated and the criteria used [5, 21, 25]. In this study, 45% of the patients were classified as MHO, which is lower than that reported in the study by Remor et al. [25] where the percentage of South American adolescents with MHO ranges from 49.4% to 55.9%. European and Asian regions have documented variable prevalences between 30.1% and 70%, probably explained by ethnic differences or local environmental factors [21–24]. No differences were found in BMI, age, sex and pubertal stage between MHO and MUHO subjects.
The MUHO patients had lower levels of c-HDL and higher levels of triglycerides than the MHO group, with statistically significant differences, which is expected considering that these two variables are included in Damanhoury’s criteria. However, the glucose levels were normal in both groups despite the presence of clinical signs of insulin resistance (84% for MUHO and 75% for MHO). This suggests that individuals with MUHO may require another type of test for the identification of dysglycemia, such as an oral glucose tolerance test or a different surrogate marker of IR [24, 26, 27].
Some researchers have included IR as a criteria for the classification of the MUHO population. It is difficult to establish a single method of estimation that can be generalized, although the most widely used method is the HOMA-IR [6, 22]. In our study, the HOMA IR was higher in the MUHO group than in the MHO group. However, this difference was not statistically significant, which may be explained by the small sample size.
This study highlights the performance of alternative and readily available insulin resistance indexes such as the TG/HDL or TyG index whose results showed statistically significant differences between both groups. These indexes have been studied in the pediatric population with adequate performance for the identification of children with high-risk metabolic phenotypes, taking into consideration that the cut-off levels vary according to the population studied, sex, ethnicity, Tanner stage and the formula used to calculate this index [8, 19, 28]. Locateli et al. evaluated children from Brazil and Colombia aged between 10 and 18 and reported a TyG index greater than 4.44 and a TG/HDL index > 2 indicative of insulin resistance [29, 30]. These indexes of insulin resistance correlated positively with UA levels, which may indicate that UA levels can be used as an indirect marker of insulin resistance.
The main limitations of this study are the sample size and the cross-sectional design, which do not allow us to evaluate associations or causalities, nor to unify the processing techniques for biochemical parameters. Further longitudinal and interventional studies are required in this regard.
Conclusions
We found that uric acid could be used as a metabolic risk marker to differentiate MHO and MUHO phenotypes in pediatric patients with obesity and overweight in a population with similar characteristics. Furthermore, it suggests that UA can be used as a marker of insulin resistance. Its use could predict the risk of cardiometabolic diseases in the adult population.


