
Introduction
Detailed knowledge of the processes occurring in the bone is critical in explaining the etiopathogenesis of many disorders and creates new possibilities for the causal treatment of some diseases [1–4].
The discovery of the receptor activator of the nuclear factor κB (RANK)/RANK ligand (RANKL)/osteoprotegerin (OPG) pathway is one of the most important discoveries concerning bone tissue metabolic mechanisms made at the end of the last century. The OPG/RANKL ratio is an important determinant of bone mass and skeletal integrity, it is also crucial in the pathogenesis of many bone diseases [1, 2, 5–7].
Most of the research into the RANK/RANKL/OPG system was conducted in adults. In recent years, there have been evaluation studies of this pathway in various diseases in children, but their number remains insufficient and the conclusions that can be obtained from them are often ambiguous. However, the interpretation of studies in children is hampered by the lack of sufficiently large control cohorts and significant differences in age and stage of puberty [8]. So far, few studies have been conducted to determine the reference values of OPG and RANKL in developmental age. Due to the limitations, the need for further research has been indicated because determining RANKL and OPG concentrations may have clinical significance in the diagnosis and therapy of this population [9–11].
Aim of the study
The aim of the study was to determine the reference values of OPG, sRANKL concentrations and the OPG/RANKL ratio in healthy children, as well as to assess the impact of selected demographic factors and biological development on the concentrations of the analyzed substances.
Material and methods
The study included 56 patients aged 1–18 years. Data obtained from the medical records (medical history and a questionnaire) of children hospitalized in the Department of Pediatrics, Neonatal Pathology and Metabolic Bone Diseases from 2010 to 2015 were analyzed.
Only healthy children were included in the group and, based on the available data, no chronic diseases or medications affecting bone metabolism were identified. The subjects were hospitalized to assess their vitamin D levels. The following exclusionary criteria were used: vitamin D hepatic metabolite concentration below reference values (30 ng/ml), long-term immobilization, previous bone fracture in the 3 months preceding the examination, acute and chronic inflammatory diseases, and decreased bone mineral density (Z-score < –1,0). To exclude a latent inflammatory process, the number of leukocytes in peripheral blood, the concentration of C-reactive protein in the serum and the erythrocyte sedimentation rate (ESR) were determined. Additionally, the exclusion criterion was positive individual and family history of bone dysplasia.
Anthropometric measurements (height/length and body weight) were analyzed for each child, on the basis of which BMI was calculated. The obtained BMI values were plotted on growth charts developed by the Institute of the Mother and Child Health Center for children over 3 years of age or on WHO growth charts for younger children. Each child was subsequently assigned to one of the 4 groups: underweight, normal body weight, overweight or obesity [12]. Additionally, the stage of puberty was assessed using standard criteria of the Tanner scale [13].
The concentration of osteoprotegerin in serum was determined using the enzyme-linked immunosorbent assay (ELISA) method (catalogue number: BI-20402) from Biomedica Medizinprodukte GmbH & Co KG (Austria) with ready-to-use quantitative determination kits. The sensitivity threshold of the method was 0,14 pmol/l, the intra-assay coefficient of variation < 10% and the inter-assay variability < 8%. However, to determine the concentration of the soluble RANKL fraction (sRANKL), kits from Biomedica Medizinprodukte GmbH & Co KG (Austria, catalogue number: BI-20422H) were used. According to the information provided by the manufacturer, the test detection level is 0,08 pmol/l, and the the reference value range is 0-6,0 pmol/l. The intra-assay variability coefficient was < 5%, and the inter-assay variability coefficient was < 9%. Osteoprotegerin bioactivity was calculated for each patient by dividing the values of OPG by sRANKL (OPG/RANKL ratio) due to its potentially better reflection of the processes involved in bone remodeling as opposed to the analysis of each cytokine level separately [8, 14].
The children underwent outpatient densitometric examination with the DXA technique using a Lunar Prodigy device (USA) within a year of their hospitalization. Bone mineral density (BMD) (g/cm2) of the entire body was assessed, excluding the skull (total body less head program) and/or the lumbar spine (AP Spine program) [15] in the form of the Z-score , i.e. their relation to the reference values for age and gender. The test results were interpreted according to the recommendations of the International Society of Densitometry (ISCD) as updated in 2019. Normal bone mass was diagnosed as a Z-score value > –1.0 [16].
Statistical analysis
The analysis was performed using the Statistica 13.3 software (TIBCO, Palo Alto, USA). Nominal and categorical variables were presented as numbers and percentages. Continuous variables were presented as mean and standard deviation (SD) and median and interquartile range (IQR) depending on the distribution of variables. Normality of distribution of continuous variables was tested using the Shapiro-Wilk test.
To assess the relationship between variables that did not meet the criterion of normality of distribution, Spearman’s rank correlation coefficient was used. A p-value < 0.05 was considered statistically significant.
Results
The characteristics of the study patients are presented in the Table I. The average age of the respondents was 10.9 years.
Table I
General characteristics of the study group of patients. Results expressed as numbers of patients (N) and percentages (%)
The total median OPG concentration in the studied patients was 4,30 pmol/l, the median sRANKL concentration was 0,30 pmol/l, and the median OPG/RANKL ratio was 14,25. The results of OPG and sRANKL concentrations and OPG/RANKL ratio values are shown in Table II.
Table II
OPG, sRANKL concentration values [pmol/l] and OPG/RANKL ratio in the analyzed group
| IQR | Mean | SD | Min | Max | Median | |
|---|---|---|---|---|---|---|
| OPG [pmol/l] | 3.15-4.90 | 4.22 | 1.66 | 0.90 | 8.60 | 4.30 |
| sRANKL [pmol/l] | 0.20-0.60 | 0.44 | 0.45 | 0.08 | 2.60 | 0.30 |
| OPG/RANKL | 7.40-20.00 | 17.21 | 17.28 | 1.06 | 92.50 | 14.25 |
The study analyzed the influence of gender, age, and stage of puberty according to the Tanner scale and nutritional status on the OPG/RANKL pathway in the subject population. The concentrations of OPG and sRANKL cytokines and their ratio were compared between the following: boys and girls, age groups (< 6, 6–10, 11–15, and > 15 years), nutritional status and in groups based on stage of puberty according to the Tanner scale. There were no statistically significant differences in the concentrations of OPG, sRANKL, the OPG/RANKL ratio or the tested parameters between these groups of participants. The numerical results are presented in Table III.
Table III
Assessment of the impact of selected factors on the concentration of OPG, sRANKL and OPG/RANKL ratio in the analyzed group
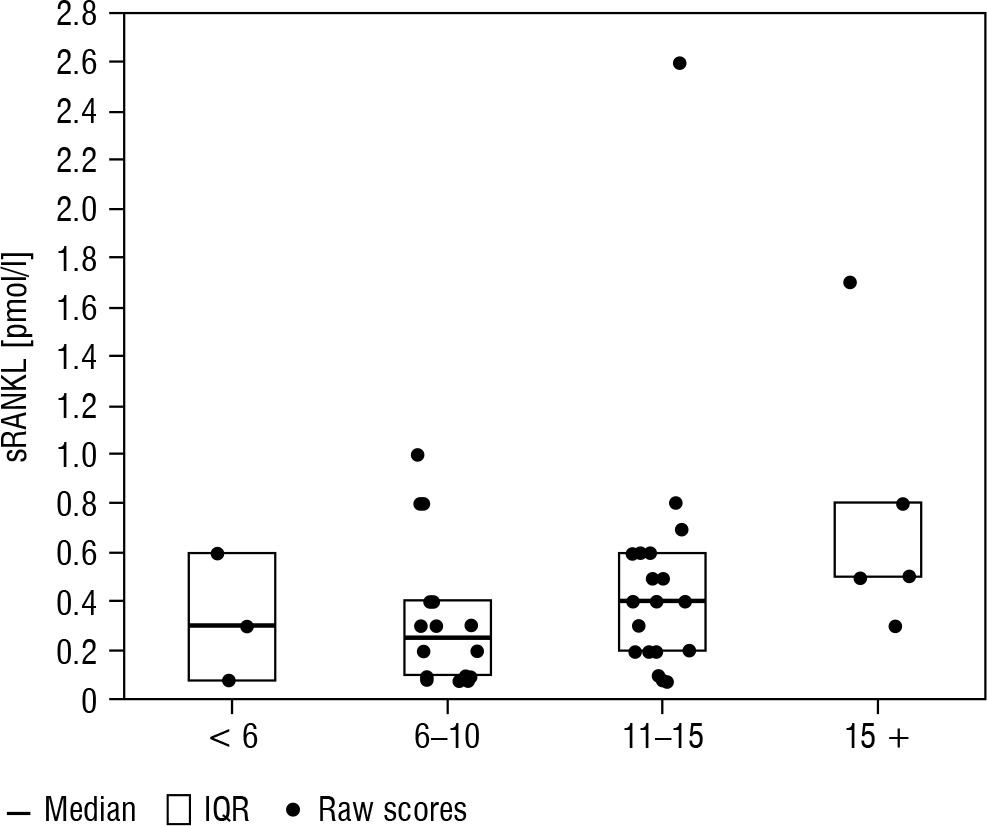
Boxplots of median and interquartile range (IQR) by age are presented in Figures 1–3.
Figure 1
Box plots of median and IQR of OPG concentrations [pmol/l] by age (< 6, 6–10, 11–15, and > 15 years)
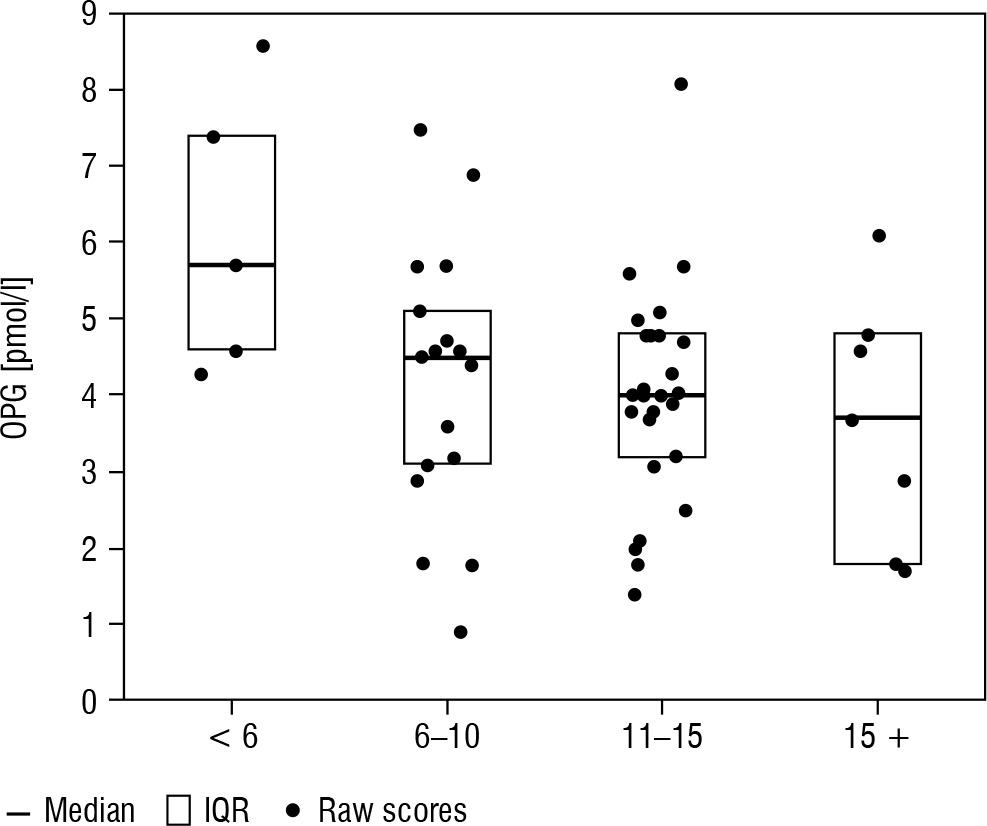
Figure 2
Box plots of median and IQR of sRANKL concentrations [pmol/l] by age (< 6, 6–10, 11–15, and >15 years)
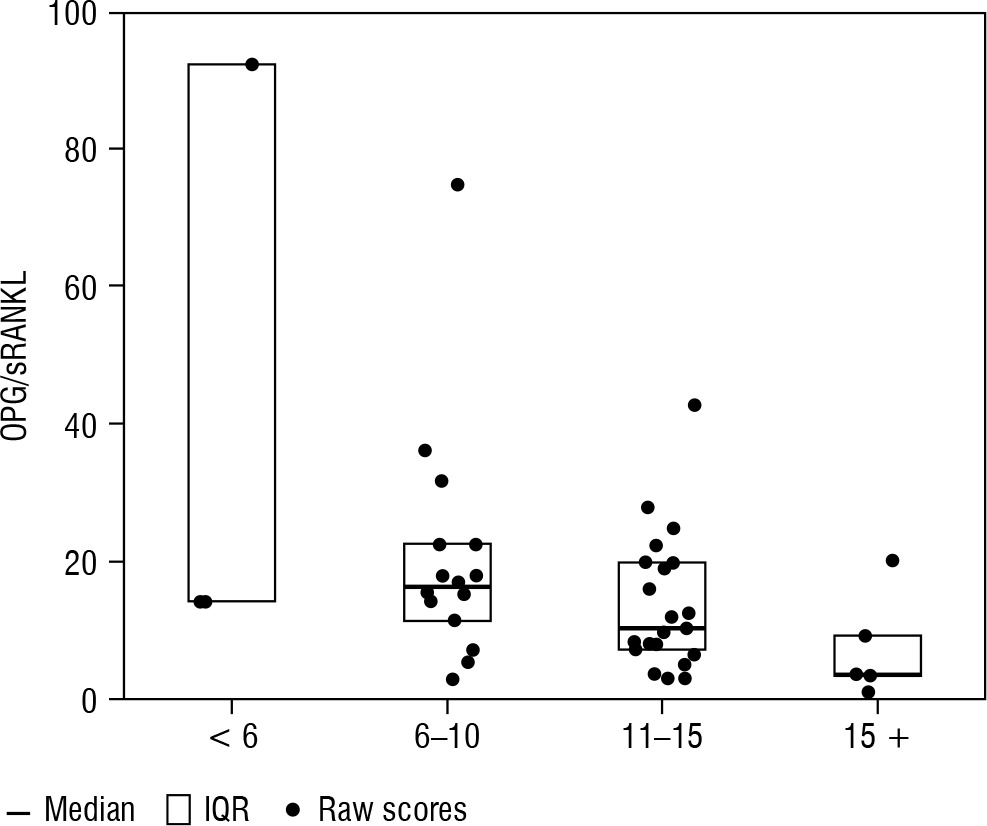
Additionally, the correlation coefficient between age, pubertal stage, BMI (according to percentile growth charts) and the concentration of OPG, sRANKL and their ratio were calculated. A statistically significant negative correlation was found between age and OPG concentration (r = –0.32, p = 0.0168) as well as age and the OPG/RANKL ratio (r = –0.34, p = 0.0228). The remaining correlation coefficients did not show statistical significance, as shown in Table IV.
Table IV
Relationship between age, BMI and stage of puberty according to Tanner scale and proteins of the OPG/RANKL system
Discussion
Initially, studies of the OPG/RANK/RANKL system were conducted among adults and it was shown that the serum OPG level increases with age in both women and men [17–22].
In a cohort study including 70 healthy children, Wasilewska et al. did not find significant differences between OPG concentrations in the age groups below and above 9 years of age [23]. However, in this study, significantly higher values were detected in patients under 3 years of age. In a study conducted on a group of 46 children (aged 1–14 years), Buzi et al. found an inverse correlation of OPG with age and increased OPG values in the youngest group of children (1–4 years) [24]. Our study showed a downward trend in OPG concentration in the age groups < 6, 6–10, 11–15 and >15 years, as well as a statistically significant negative correlation between age and OPG concentration and the OPG/RANKL ratio. The results of our research are similar to the results obtained in the latest study by Tietze et al., in which OPG concentrations decreased steadily from infancy to adulthood, regardless of gender [8]. However, like Akhtar Ali et al. in a large cohort study evaluating 300 healthy children, we found these differences to be statistically insignificant [10].
As for RANKL, studies involving adults showed a tendency of serum RANKL and RANKL/OPG levels to decrease with age, especially in postmenopausal women [21, 23]. In a study including a paediatric population, Buzi et al. [24] observed a slight decrease in RANKL levels with age, which was confirmed by Akhtar Ali et al. [10] in a larger group of patients, except for the age group of 11–15 years.
Wasilewska et al. [23] observed lower values in younger children (age < 9 years) compared to older children (> 9 years), and at the same time found a correlation between sRANKL and the RANKL/OPG ratio in serum and age. In our study, the median sRANKL concentration was higher in the youngest group of patients (< 6 years) (0.30 p/mmol/l) compared to participants aged 6–10 years (0.25 pmol/l). Also, as in the study conducted by Akhtar Ali et al. [10], an increase in the sRANKL concentration was observed in the group of 11–15-year-olds (0.40 pmol/l). It is suggested that this trend may result from the high rate of bone growth and remodeling occurring in this period with the peak at the age of 11–13 years in girls and 13–15 years in boys [25]. This is probably due to the effect of sex hormones, which have been shown to regulate the expression of RANK and RANKL [7, 8, 26]. In contrast to Akhtar Ali et al. [10], in our study, high sRANKL levels were also observed in children >15 years of ages, which may be related to the potentially continuing high bone turnover at this age, especially in boys.
Recently, a large study was conducted in which an attempt was made to establish reference values for sRANKL, OPG and the RANKL/OPG ratio in the developmental age population [8]. In boys, sRANKL percentiles were found to be the highest in infancy (0–2 years) and then gradually decreased until 7 years of age. A second peak of sRANKL concentration associated with the onset of the pubertal growth spurt was observed at the age of 12–13 years, before a final decline to reach values comparable to adults at the age of 18 years. In girls, sRANKL concentrations showed a continuous, slow decrease in percentiles from infancy (0–2 years) to adulthood. The results of our study partially correspond to the observations published by Tietze et al. [8] in that the youngest age group has the highest sRANKL concentration with a gradual decrease in the prepubertal period and a peak increase in concentration during puberty. The divergent results of our study in the oldest age group (> 15 years) compared to other studies may result from a physiological gender-dependent difference in bone modelling during puberty, which occurs about 2 years later in boys than in girls [25].
A cohort study conducted by Wasilewska et al. on 70 individuals, showed a more than 3-fold higher level of RANKL and a statistically significant higher RANKL/OPG ratio in boys compared to girls, while the OPG concentration did not seem to be affected by gender [23]. In our study, the concentrations of RANKL, OPG and the OPG/RANKL ratio were comparable between the sexes. Our results are consistent with the data obtained by Buzi et al. [24], as well as with a more recent cohort study conducted by Akhtar Ali [10]. The lack of association between OPG and gender, which was found in our group, was also supported by the latest study conducted by Tietze et al. [8].
Several studies conducted in both healthy and obese children and adults have found an inverse correlation between plasma OPG levels and standardized body weight and BMI [8, 10]. Dimitri et al. suggested that children with obesity have increased bone resorption relative to bone formation. Additionally, it has been suggested that overweight children have low bone turnover and consequently reduced OPG levels, which may be due to the lack of adequate physical activity [27]. The cause of reduced OPG secretion in obese children has been alternatively explained by increased osteoclast activity associated with the secretion of adipokines such as leptin and the activation of osteoblast leptin receptors [27]. In the present study, however, no correlation was found between OPG, sRANKL or OPG/RANKL and BMI, but this may be due to the small number of overweight patients.
In the study group of Akhtar et al. [10], RANKL levels significantly differed between Tanner stages, with the highest RANKL levels noted in Tanner stage 3 and the lowest in Tanner stage 5. Wasilewska et al. also found increased RANKL levels in patients with Tanner stage 3 compared to patients with Tanner stage 1 and observed a second peak in the Tanner stage 5 [23]. In the authors’ study, the highest levels were noted in Tanner stage 4, and a decrease was noted in stage 5 patients, as in Akhatar et al. [10]. The discrepant results assessing RANKL levels during puberty may result from differences in puberty between boys and girls related to the effect of sex hormones on the system of these cytokines, which indicates the need for further research involving a larger group of patients, with separate analyses for boys and girls.
In the case of OPG, no difference was found in the median levels of this cytokine between the individual Tanner stages, which is consistent with the observations of Wasilewska et al. [23] and Akhtar et al. [10]. The lack of changes in OPG levels at higher Tanner stages requires further consideration, because oestrogen is a known regulator of OPG expression [7, 10, 26].
Study limitations
The major limitation for the current study is the small sample size. Furthermore, serum sRANKL concentrations below level of development or equal to zero were observed in some patients (10,7% and 19,6%, respectively). Similar results were obtained by other authors. It may be due to the influence of external factors at the pre-analytical level [8].
Conclusions
In healthy children and adolescents, the highest OPG concentrations are observed in the youngest age group, followed by a gradual decrease until adulthood. On the other hand, sRANKL in healthy children shows a tendency to increase during adolescence.
The values of OPG, sRANKL concentrations and the OPG/RANKL ratio are comparable between sexes, categorized BMI values and puberty stages. Future studies are needed to assess changes in the concentrations of these cytokines at different stages of puberty depending on sex. Also, the apparent lack of relationship between OPG concentration and puberty stages requires further investigation.


