
Introduction
Diagnostics of growth hormone deficiency (GHD) is one of the major challenges in pediatric endocrinology. The diagnosis should take into account the clinical probability of GHD and the assessment of growth hormone (GH) secretion in stimulation tests (GHST) [1, 2].
The incidence of GHD in pediatric population is relatively rare, according to the recent review of population-based studies [3], the reported frequencies range from 1 : 30,00 in the oldest studies [4, 5] to about 1 : 1,000 in Finnish registries [6] and even higher in the recent Italian study [7]. There are also studies indicating a high rate of false positive results of GHST [8–10]. The risk of overdiagnosis GHD concerns mainly the patients with idiopathic, isolated form of the disease [1, 9]. Problems with proper interpretation of the results of GHST and current knowledge on factors influencing these results have been widely described by Kamoun et al. [11].
It is also documented that idiopathic, isolated GHD, diagnosed in childhood is a disease of fundamentally transitional nature, as in the majority of patients after completion of growth promoting therapy, GH secretion in the repeated GHST appears to be normal, even with respect to “pediatric” criteria [12]. Such normalization of GH secretion is observed already in mid-puberty [13, 14]. This phenomenon, described as “transient GHD”, may be explained either by real improvement of previously decreased GH secretion or by false positive results of GHST in childhood. Interestingly, similar problems were highlighted already in 1990s by Cacciari et al. [15].
In the majority of studies on GHD in pediatric population, auxological parameters are expressed as SDS values for sex and age to enable direct comparisons among children. Bone age (BA) is usually presented in relation to chronological age (CA). This is undoubtedly justified by the adopted statistical methodologies. Nevertheless, in this way the raw data are lost from the analysis, that makes impossible observations based directly on them.
The aim of present study was to identify clinical parameters associated with the diagnosis of GHD based on the results of GHST in children with short stature.
Material and methods
The retrospective analysis included 1,592 children (985 boys, 607 girls), aged 10.3 ±3.4 years (mean ±SD), with short stature, in whom standard diagnostics, including height and weight measurements, two GHST (after clonidine and glucagon) and BA assessment, was performed in years 2003–2020.
Short stature was defined as patient’s height below 3rd centile for age and sex, according to Polish reference charts [16]. Based on patients’ history, all children with any congenital malformations, genetic defects, multiple pituitary hormone deficiency (MPHD) chronic diseases and/or therapies that might disturb growth, as well as ones with acquired GHD or MPHD were excluded from the study. Thus, differential diagnosis included isolated, non-acquired GHD and idiopathic short stature (ISS).
Height SDS (hSDS) was calculated according to the reference data of Palczewska and Niedźwiecka [16]. For the assessment of nutritional status, body mass index (BMI) was calculated and expressed as BMI SDS with respect to the reference data of Kułaga et al. [17, 18]. Bone age was assessed using Greulich-Pyle standards [19], based on X-ray images obtained within 6 months before or after performing GHST, in the majority of patients – simultaneously with GHST.
The diagnosis of GHD was based on GH peak below 10.0 µg/l in two stimulation tests: with clonidine 0.15 mg/m2, orally (GH concentrations measured every 30 minutes from 0 to 120 minute of the test) and with glucagon 0.03 mg/kg (not exceeding 1.0 mg), s.c. (GH concentrations measured in 0, 90, 120, 150 and 180 minute of the test). The concentrations of GH were measured by the two-site chemiluminescent enzyme immunometric assay (hGH IMMULITE, DPC) for the quantitative measurement of human GH, calibrated to WHO IRP 80/505 standard or to 98/574 standard in different years. We cannot guarantee full equivalence of the different laboratory kits used over the 18 year period, nevertheless – according to current standards – the cut-off of GH peak in GHST diagnostic for GHD is the same for different combinations of two tests and independent from the used method of determining GH concentrations [1, 20].
Statistical analysis
First, distribution of particular variables was checked with Shapiro-Wilk test. As for almost all variables, the assumption of normal distribution was not met, descriptive statistics were presented as median and interquartile range (25 centile; 75 centile). Accordingly, appropriate non-parametric tests for independent variables were used in statistical analyses – Mann-Whitney U test for comparisons between two groups, while Kruskal-Wallis test with appropriate multiple post-hoc comparisons for more than two groups. Statistical analysis was performed with Statistica 13.1
Results
Based on GH peak in the two GHST below 10.0 µg/l, GHD was diagnosed in 604 patients (37.9%), including 378 out of 985 boys (38.4%) and 226 out of 607 girls (37.2%); the remaining patients were diagnosed with ISS. There was no difference between the patients with GHD and ISS in CA, BA, height and hSDS, while children with GHD had significantly lower (p < 0.001) body mass, BMI and BMI SDS than ones with ISS (Table I).
Table I
Characteristics of the patients with respect to the diagnosis
[i] p-value – difference between the patients with GHD and ISS in Mann-Whitney U test
Data presented as median and interquartile range
BA – bone age; BMI – body mass index; CA – chronological age; GH – growth hormone; GHD – growth hormone deficiency; GHST – growth hormone stimulation test; hSDS – height standard deviation score for age and sex; IGF-1 – insulin-like growth factor-1; ISS – idiopathic short stature
Significant differences were observed between boys and girls in almost all the analyzed variables, except for BMI SDS and GH peak in two GHST (Table II), thus, further analyses were performed separately for boys and for girls.
Table II
Characteristics of the subgroups of boys and girls
[i] p-value – difference between boys and girls in Mann-Whitney U test
Data presented as median and interquartile range
BA – bone age, BMI – body mass index; CA – chronological age; GH – growth hormone, GHST – growth hormone stimulation test; hSDS – height standard deviation score for age and sex; IGF-1 – insulin-like growth factor-1
Analysis of raw data
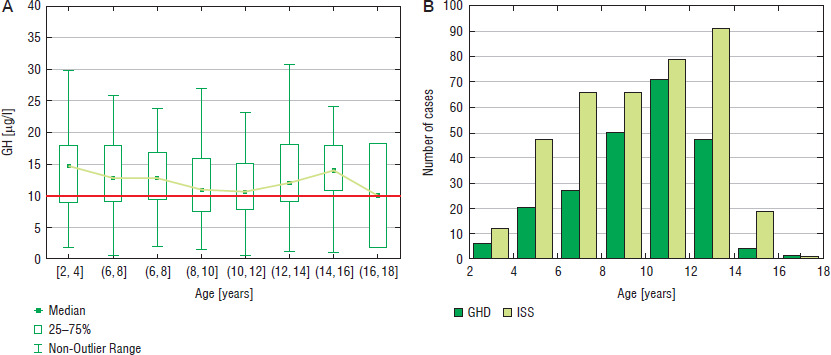
In the analysis of raw data, the highest number of boys was diagnosed at the age of 12–14 years (103 cases), the incidence of GHD was the highest (44.6%) in the same age group (Fig. 1). In girls, the highest number of patients was diagnosed with GHD at the age of 10–12 years (71 cases), the incidence of GHD was the highest (47.3%) in the same age group (Fig. 2).
Figure 1
GH peak in two GHST (A) and the incidence of GHD and ISS (B) in boys with respect to chronological age
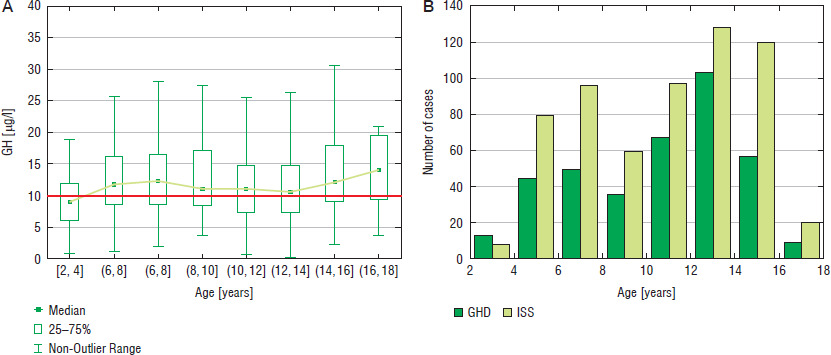
Figure 2
GH peak in two GHST (A) and the incidence of GHD and ISS (B) in girls with respect to chronological age
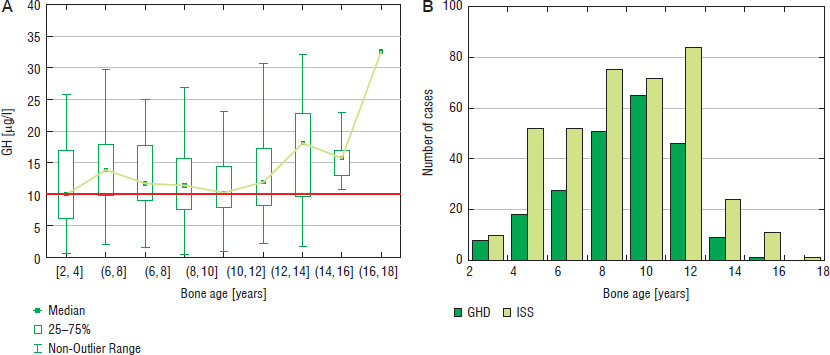
Similar analysis performed with respect to bone maturation (expressed as BA) and sex showed that among boys the highest number of patients (81 cases) was diagnosed with GHD at BA 10–12 years, the highest incidence of GHD (46.0%) was observed in the same group and decreased in the groups with older BA; there should also be noted that the highest number of patients was subjected to diagnostics with BA 12–14 years (178 cases), while the incidence of GHD in this group (38.0%) was lower (Fig. 3). Among girls, the highest number of patients (65 cases) was diagnosed with GHD at BA 8–10 years, the highest incidence of GHD (47.4%) was with observed in the same group and decreased in the groups with older BA; there should also be noted that a number of patients subjected to diagnostics with BA 10–12 years was higher than with BA 10–12 years (Fig. 4).
Figure 3
GH peak in two GHST (A) and the incidence of GHD and ISS (B) in boys with respect to bone age
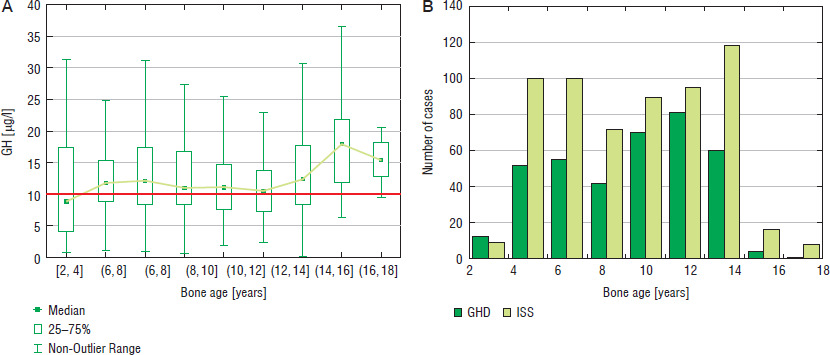
Figure 4
GH peak in two GHST (A) and the incidence of GHD and ISS (B) in girls with respect to bone age
Some relationships were also observed between patients’ height and the incidence of GHD. In boys, the highest number of patients (92 cases) GHD was diagnosed at height 140-150 cm, in this group the incidence of GHD was also the highest (44.0%) and decreased (to 31.5%) at height 150–160 cm and over 160 cm (29.4%); the number of patients subjected to diagnostics was also lower in the latter groups (Fig. 5). In girls, the highest number of patients (64 cases) was diagnosed with GHD at height 130–140 cm and slightly less (61 cases) at height 120–130 cm, the incidence of GHD was the highest (47.4%) and height 130–140 cm and decreased rapidly (to 26.5%) at height 140–150 cm, despite similar number of girls subjected to diagnostics, while none of the girls was diagnosed with GHD at height over 150 cm (Fig. 6).


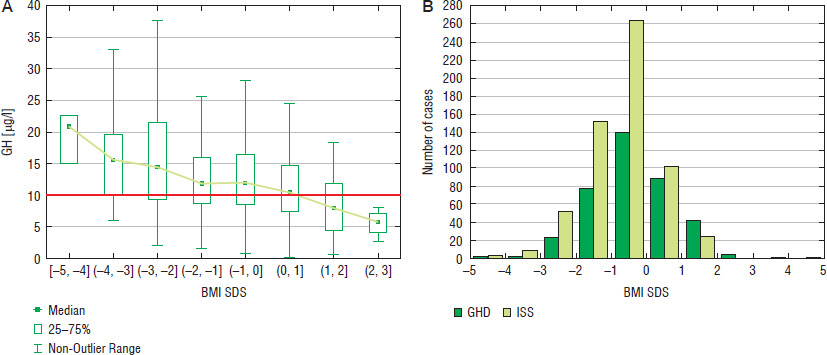
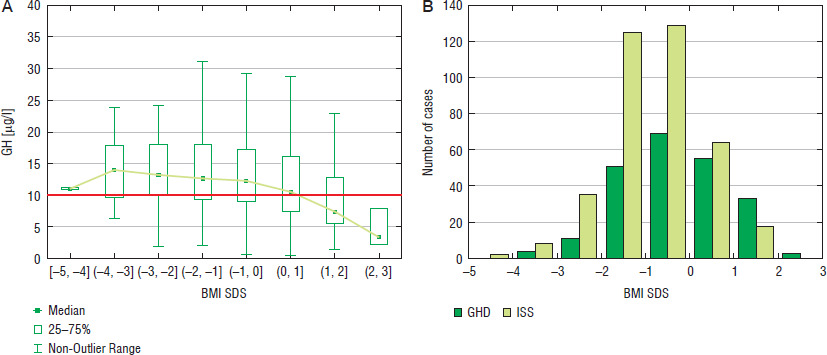
Relationships between nutritional status and the results of GHST
For the assessment of nutritional status, BMI values were expressed as SDS for age and sex. The incidence of GHD increased with BMI SDS, both in boys and in girls even exceeding 50% at BMI SDS over 1.0 in both sexes (Fig. 7 for boys and Fig. 8 for girls).
Discussion
First important finding in our study was the decrease in the frequency of GHD after exceeding certain values of age, BA and height. Taking into account that this phenomenon was observed particularly after reaching BA 12 years in boys and 10 years in girls or height over 150 cm in boys and 140 cm in girls, it seems that this could be related to the physiological increase of GH secretion at mid-puberty rather than to real self-healing of the patients suffering from GHD. It should also be noted that we observed the increasing incidence of GHD with age in boys aged up to 14 years and in girls aged up to 12 years (and similarly up to two years younger BA in both sexes) that could probably be explained by physiological changes of GH secretion in peripubertal period [21]. It is well known from almost 40 years that spontaneous GH secretion increases at puberty due to higher rate of GH release during secretory bursts [22–24]. Our observations, concerning the results of GHST seem to be consistent with those findings. In order to overcome this problem, it was proposed also over 30 years ago to perform sex steroid priming before GHST in selected groups of prepubertal children [25]. This approach has been confirmed in the Guidelines of Pediatric Endocrine Society from 2016 [1]. In a very recent paper, Lennartsson et al. [26] have demonstrated that sex steroid priming decreases the divergence between the results of the test of spontaneous GH secretion and pharmacological GHST. However, there are some concerns that the results of primed GHST may overestimate GH secretion and lead to false negative results of these tests [27]. Problems related to optimal use of sex steroid priming in clinical practice have been discussed in a quite recent paper of Partenope et al. [28]. In our patients, sex steroid priming has not performed. Another solutions of the problem of overdiagnosis GHD in peripubertal children could be differentiation of cut-off limits of GH peak in GHST based on pubertal stage [27] or reassessment of GH secretory status of GH-treated patients after entering puberty [9, 29]. Problems related to optimal management of short children in peripubertal period have been summarized by Torres-Santiago and Mauras [30]. However, a recent paper of Chimatapu et al. [31] brings the conception of evolving GHD as a disease that may occur in children with previously normal results of GHST.
The results of our study confirmed known relationships between nutritional status and GH secretion [1, 32], as higher incidence of GHD was observed in overweight or obese children than in those with normal weight or underweight. The inverse association between BMI SDS and GH peak in GHST has also been confirmed in a large group of patients by Thieme et al. [33]. Based on the results of meta-analysis, Abawi et al. [34] have proposed weight-adjusted (lower) cut-offs of GH peak in GHST for children with overweight and obesity. Such suggestion has not been introduced to clinical practice in Poland. Nevertheless, in a recent study of Budzulak et al. [35], BMI z-score values over 0 were associated with better growth response to GH therapy.
The most important limitations of our study are missing data on pubertal stage, height velocity and parental heights in some patients. In a retrospective study, covering a multi-year period, there was no possibility to complete them in a reliable manner. So, it was impossible to include these potentially significant variables in the analysis.
Conclusions
The assumption of the same cut-off value of GH peak for all GHST preformed in children, irrespectively of patients’ age (and related parameters as height and bone maturation) or nutritional status, led to the significant differences in the incidence of isolated GHD among children with short stature, stratified with respect to these variables. It seems reasonable to personalize the interpretation of GHST results in pediatric population by taking into account clinical context.


