
Introduction
The “Barker Hypothesis” postulates that an important component of risk for future disease is determined in the intrauterine environment by means of programming the birth weight (BW), which exerts influences on childhood weight and mortality due to cardiac diseases in adulthood [1].
Low birth weight (LBW) for gestational age (GA) implies increased perinatal morbidity and mortality rates, and the development of non-communicable chronic diseases (NCCD) at adult age – mainly when related to intrauterine growth retardation (IUGR), and childhood overweight and obesity [2]. Complete understanding of this phenomenon has not yet been established [1].
The association between LBW and metabolic disturbances, which have cardiovascular diseases (CVD) as their final outcome, possibly arises from the relationship between BW and growth recovery, among other factors, commonly found as a post-natal consequence of this condition, and the hormone and anthropometric profile resulting from this combination [2].
Aim of the study
The aim of this study was to describe the development of anthropometric indicators of pre-pubertal children born at full term, who were either small for gestational age (SGA) or appropriate for gestational age (AGA), up to the sixth month of life and, comparatively, later at school age.
Material and methods
This prospective cohort study, conducted at a public university hospital, evaluated children born at full term, through to school age, who were enrolled between the years 2010 and 2013. This was a convenience sample, and the processes of triage and finding patients in the first stage of the study were carried out in local public maternity hospitals. Those recruited were newborns born at full term, SGA (BW ≤ percentile 10 for the reference GA) and AGA (BW between the percentiles 11 and 90 for the reference GA) according to the classification proposed by Intergrowth [3]. The following factors for exclusion from the study were considered: twins, congenital malformations, genetic syndromes, permanently affected central nervous system conditions, perinatal TORCH infections, intercranial haemorrhage grade III and IV, sepsis, and respiratory, renal, and/or associated cardiac diseases.
The children were followed up on a monthly basis, up to 6 months of life, every 2 months up to 1 year old, then every 3 months in the first 2 years, and then a final re-evaluation in the period between 4 and 6 years of age.
The evaluated anthropometric outcomes were weight gain (WG) and growth, by means of their respective indicators, recovery of growth, and time and intensity of recovery. Recovery of growth was characterised as a difference ≥ 0.67 SD in the weight/age (W/A) indicator, in Z score, between the two time intervals of a series of observations [2], which were considered between birth and the visits during the first 6 months of life, and its intensity was obtained by calculating this delta.
Weight was measured on an electronic scale (Welmy, model W-200); for height, a stadiometer (ROSS, Ohio, USA); and for arm circumference, a non-stretchable measuring tape (Sanny) were used. The subscapular (SSF) and triceps skinfolds (TSF) were measured using an adipometer (Lange Skinfold Calliper, England, UK). The arm circumference and triceps skin-fold measurements were taken on the right arm. These measurements were taken in duplicate, in compliance with the Brazilian Paediatric Society guidelines [4]. The same procedures were adopted for all the patients in the two groups.
For characterisation of the nutritional status, at birth, the indicators were calculated in Z scores and percentiles by means of Intergrowth-21st software, version 1.0.5830.27827 from 2014. For characterisation of the anthropometric diagnosis at school-age, the anthropometric measurements and their respective indicators in Z scores were considered, calculated by means of WHO Anthro software version 3.2.2 from 2011, for children up to 5 years of age; and by means of WHO Anthro plus software, version 1.0.4 from 2007, for those aged 5 years or older. The data were categorised according to the World Health Organisation proposal (2007) [5].
As regards the remaining indicators, the following were used: arm circumference for age (AC/A), obtained and classified according to Frisancho (1990) [6]; skin folds for age (TSF/I, SSF/I) and the sum of these values for age, obtained according to NCHS (1976-1980)7 and classified according to Frisancho (1990) [6].
The arm muscle area (AMA) was calculated based on the TSF and AC, according to the formula proposed by Jelliffe and Jelliffe (1969) [8], and this variable was categorised according to Frisancho [6]. The percentage of fat was calculated based on determination of the quantity of fat in kilograms, by using the protocol of Dezemberg et al. (1999) [9], and categorised according to McCarthy et al. (2006) [10], a reference that only considers children over the age of 5 years; therefore, 4 participants were not included in this categorisation, all of whom belonged to the SGA Group.
Breastfeeding in the first months of life was classified according to the WHO (1991) criteria into exclusive breastfeeding, predominantly breastfeeding, and mixed breastfeeding [11].
The normality of the quantitative variables was evaluated by descriptive statistics and normality tests (Shapiro-Wilk). The variables did not show distribution similar to that of the normal curve at the level of 5% and were expressed by median and percentiles 25 and 75, and they were compared by the Mann-Whitney test.
The project was approved by the Ethics Committee of the “Maternidade Climério de Oliveira” hospital/Post-Graduation Course in Medicine and Health (CEP 1.741.320/2016).
Results
In total, 65 newborn infants were preselected. However, 5 of them were not included due to prematurity (n = 03) and congenital infection (n = 02); therefore, 60 infants remained, of whom 20 (33.3%) were born AGA and 40 (66.7%) were born SGA. During the course of the study, 29 children were lost to follow-up, so the final evaluation at the ages between 4 and 6 years was performed with 19 SGA children and 12 AGA children.
Therefore, the study was composted of 31 children: 19 (61.3%) born SGA – 9 (47.4%) of the female sex, and 12 AGA (38.7%) – 6 (50%) of the female sex. The median of the age of the groups was 5.6 years with respective interquartile intervals for the SGA and AGA groups.
Table I presents the data of children of both groups at birth, data of children who were regularly monitored, and those lost to follow-up, showing statistical difference for the variables analysed between the patients of the SGA and AGA groups who continued to attend the scheduled visits, and similarity between them and those who did not continue with scheduled re-examination throughout the period of follow-up. BMI was not performed in the first 2 years of life.
Table I
Anthropometric characteristics at birth of infants born SGA and AGA
[i] SGA - small for gestational age; AGA - appropriate for gestational age; HC - head circumference; W/A - weight for age; L/A - length for age; HC/I - head circumference for age - Intergrowth reference (2014) a p < 0.05 (Mann-Whitney Test) - comparison between SGA and AGA groups followed up a p < 0.05 (Mann-Whitney Test) - comparison between SGA and AGA groups followed up, and which represented follow-up weight
With regard to growth and WG in the first 6 months of life, analysis of the indicators revealed that for both W/A and for L/A, all the children who had deficit at birth recovered these indicators over the course of the period.
The occurrence of recovery of growth was observed in 89.5% of the children born SGA; for 73.7% of them this occurred during the first 2 months of life (data not presented). The intensity of growth recovery, expressed by the median of the maximum delta for the indicator W/A over the course of the first 6 months of life, was 1.41 (0;82; 1.94) in the SGA group.
Both groups showed high percentages of exclusive breast feeding in the first 6 months of life: SGA group 63.1% and AGA group 58.3%, so the median number of days of exclusive breastfeeding in the groups were 180 (126; 180) and 179.5 (138.75; 181.5), respectively.
Table II shows the anthropometric parameters according to the classification of BW for GA, at school-age, in which it was noted that the values with reference to the measurements and indicators of the SGA group were shown to be lower, with statistical difference between the groups.
Table II
Anthropometric indicators of schoolchildren born SGA and AGA
There was no record of increased weight in the sample, and only 2 children of the SGA group had low weight for their age.
Figure 1 shows the percentage distribution of the indicators of body composition according to the groups, in which the larger portion of the children had appropriate reserves for sex and age.
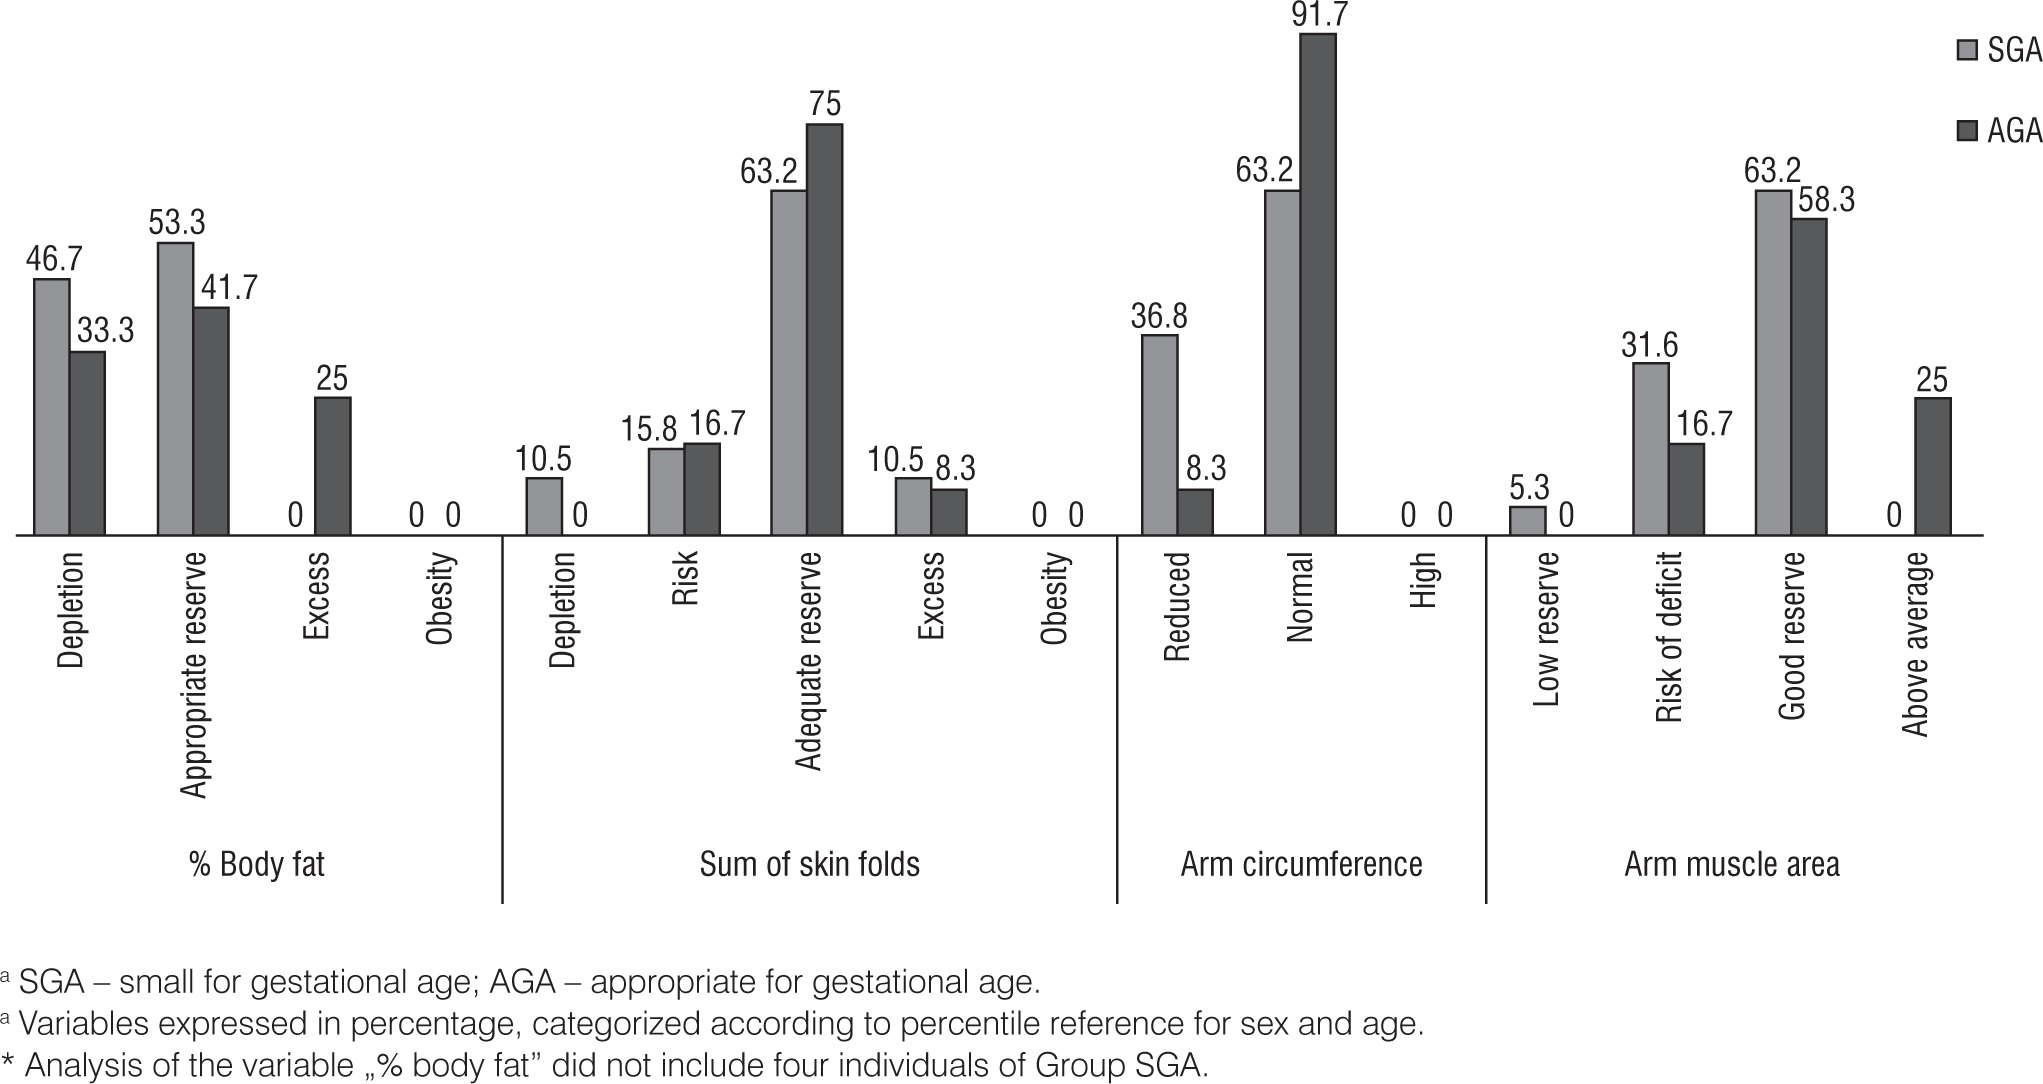
The variables of body composition such as percentage fat, sum of skin folds, AC, and AMA were also evaluated continuously at school-age, respectively, as follows: SGA group: 11.18% (IQ: 6.00; 14.25), AGA group: 14.68%; (IQ: 12.13; 19.22), SGA group: 12.00 (IQ 10.00; 14.00), AGA group: 13.75 (IQ 11.50; 15.50), SGA group: 15.70 (IQ 15.10; 17.10), AGA group: 17.50 (IQ 16.15; 18.95), SGA group: 14.73 (IQ 13.73; 17.01), and AGA group: 17.06 (IQ 15.20; 21,08). Statistically significant differences were observed for the medians between the groups, with the exception of the sum of skin folds.
Discussion
Nutritional status at birth and early recovery of growth did not seem to influence on the anthropometric indicators evaluated at school-age in the studied sample.
Birth weight, growth trajectory, WG, lean and fat mass development over the course of the first years of life, in addition to the pattern of body fat deposition and dietary habits, are factors that may exert an influence on future cardiovascular outcomes.
Children born SGA may have growth and WG patterns that differ from those of children born AGA. The former usually have a compensatory pattern, known as growth recovery (postnatal catch-up growth) [12].
Despite the follow-up losses presented, the recovery of growth was observed in 89.5% of the children born SGA, which is in agreement with literature data [2]. Children born SGA underwent this recovery at an early and intense stage, so at school-age, most of them showed appropriate indicators of growth, and adipose and muscle tissue reserves. However, it is necessary to emphasise that they were still smaller and lighter than children born AGA.
These findings, together with others previously available in the literature, show contrast with the previous proposals based on the Developmental Origins of Health and Disease Hypothesis (DOHaD).
Data from NHANES III, in a study conducted by Hediger et al. (1998) have previously shown similar results. They demonstrated that in spite of the occurrence of growth recovery in the first 6 months of life, children born SGA tended to remain smaller and lighter at 47 months of life [13].
Going beyond the appropriateness of the growth indicators and in view of what has been said about cardiovascular risk shown by children born SGA, defended by DOHaD, it is important to analyse the adiposity of these children.
The results showed a considerable proportion of appropriateness of the indicators of adipose and muscle tissue reserves for both groups; however, despite the recovery of growth, children born SGA were observed to obtain lower medians of percentage body fat and AC, with statistical difference between the groups.
The longitudinal study of Kramer et al. (2014), who evaluated the effect of LBW for GA and WG in adiposity, showed a similar finding. Children born SGA were not only smaller and thinner, but continued to have a lower quantity of body fat (both in proportional and absolute terms) than their AGA peers at the ages of 6.5 and 11.5 years [14]. The authors emphasised that the combination between being born SGA and showing rapid growth during childhood did not increase the risk of overall or trunk adiposity in comparison with those born AGA, with a trajectory of normal weight in the first 6 months of life. Children with BW < 2500 g were excluded from this study – possibly those with higher Intrauterine growth retardation (IUGR) - and nevertheless the authors were faced with these findings. In the present study, however, the majority of the children SGA group (63.2%) had a BW < 2500 g, denoting the possible influence of LBW/GA on the lower quantity of body fat at school-age.
Another variable to be considered as a factor capable of influencing future cardiovascular outcomes is the time at which this recovery of growth is processed. Bann et al. (2014) described the different outcomes associated with the process of WG, in different stages of life, and pointed out that the higher gain before birth and in early childhood could be beneficial, leading to a greater quantity of lean mass (LM), while the higher gain after the first year of life and during adolescence could be harmful in the future, by increasing the predisposition for accumulating adipose tissue and its concentration in the central region of the body [16].
Up to now, in agreement with the results presented, even in view of the occurrence of early and intense growth recovery, the LM content expressed by arm muscle area (AMA) showed lower median values in the children of the SGA group.
The main organic consequence of the lower proportion of LM associated with LBW is the reduction in metabolic activity, and if this were associated with a diet rich in high-energy foods, it could predispose to a higher level of future adiposity [17]. This consequence on glucose metabolism is so important that some authors have affirmed this to be the explanation for the hypothesis of the early origins of adult diseases. This is because a lower proportion of lean tissue, programmed by the LBW, could have an adverse effect on insulin sensitivity, which could be a mechanism that partially links LBW and CVD [18].
A recent meta-analysis showed that low birth weight and small birth for gestational age are factors that are associated with outcomes such as cardiometabolic and glucose metabolism disorders, in addition to changes in body composition and risk of developing metabolic syndrome [19].
The lower AMA values shown by the SGA group alone does not yet seem to constitute reason for concern about future cardiovascular outcomes, bearing in mind the high rates of appropriate indicators of body composition shown. Nevertheless, it is valid to continue to monitor the studied group, particularly as far as the habits of life are concerned, which gain force in the equation of determining future outcomes as the years go by. Moreover, previous studies of early growth have shown conflicting results about the relationships of growth trajectories with cardiometabolic outcomes, so that growth is not consistently associated with cardiometabolic risk factors. It has been hypothesised that some trajectories may favour lean mass rather than fat mass accumulation, which can change the cardiometabolic outcome [20].
The appropriateness observed relative to the nutritional status of the group and physical development, expressed by the growth and body composition indicators, may be justified by the follow-up with which the children were provided over the course of their first years of life. This possibility influenced the high percentages of exclusive breastfeeding (EBF) found among the other questions involved in the health care of these individuals.
A bioimpedance investigation was not performed in this study, but it should be considered in future investigations.
The adequate assistance with which these children were provided during their first years of life may, therefore, have made it possible for them to recover their healthy growth – a concept being debated at present, proposing that nutritional strategies aiming to promote recovery of healthy growth must include the monitoring of weight, height, and adiposity indicators, in order to guarantee that if risk factors associated with metabolic diseases appear, they will be observed at an early stage; and this concept will also assure adequate promotion of breastfeeding [21].
Moreover, the findings relative to the anthropometric measurements and indicators evaluated were compatible with the age range of the population in question, which is the age that precedes the period when rebound adiposity is found. This time is characterised by lower BMI and adiposity values [22].
Conclusions
It can be concluded that the sample of SGA children with accelerated WG in early childhood, at school-age, showed no major alterations related to anthropometry. This result is of great clinical importance because the data concerning the description of the process of growth recovery in this population, and their effects on growth, composition, and distribution of body fat, are still inconclusive in the literature.
The main limitation of this study was the sample size; however, its findings denote the importance of clinical follow-up and encouragement of breastfeeding as strategies to assure the appropriate growth of children born SGA.


